This article was originally published on AIXA AI, the artificial intelligence company behind Olearia.
Olive oil moves somewhere between fifteen and twenty billion dollars a year globally. Spain alone produces nearly half the world’s supply. Jaén, a single Andalusian province, squeezes more extra virgin olive oil every year than the whole of Italy. It is a huge, ancient market, and an economically decisive one for regions where the olive tree isn’t just another crop — it’s the crop.
And yet, at seven in the morning on any given Monday, the going price for EVOO at source is discussed in a WhatsApp group.
This isn’t an exaggeration. It is literally how information travels through much of the Spanish olive oil sector. WhatsApp groups, phone calls between acquaintances, rumours that get confirmed or debunked over the course of the day. Weather data comes from generic apps that can’t tell an olive grove from a wheat field. And trade flows — who is selling to whom, how many tonnes, at what price — require navigating the guts of Eurostat with the patience of a Benedictine monk.
Unlike other agricultural commodities that have consolidated platforms — AgFlow for cereals, S&P Global for raw materials in general — olive oil had nothing comparable. The data existed. It was there, scattered across twenty different official sources, in formats apparently designed to be mutually incompatible. Pulling it all together by hand was a full-time job that nobody had time to do.
We set out to build the platform that didn’t exist. “A couple of months,” we said.
We’ve been at it for a year. This is what has come out of it, and what we have learned the hard way.
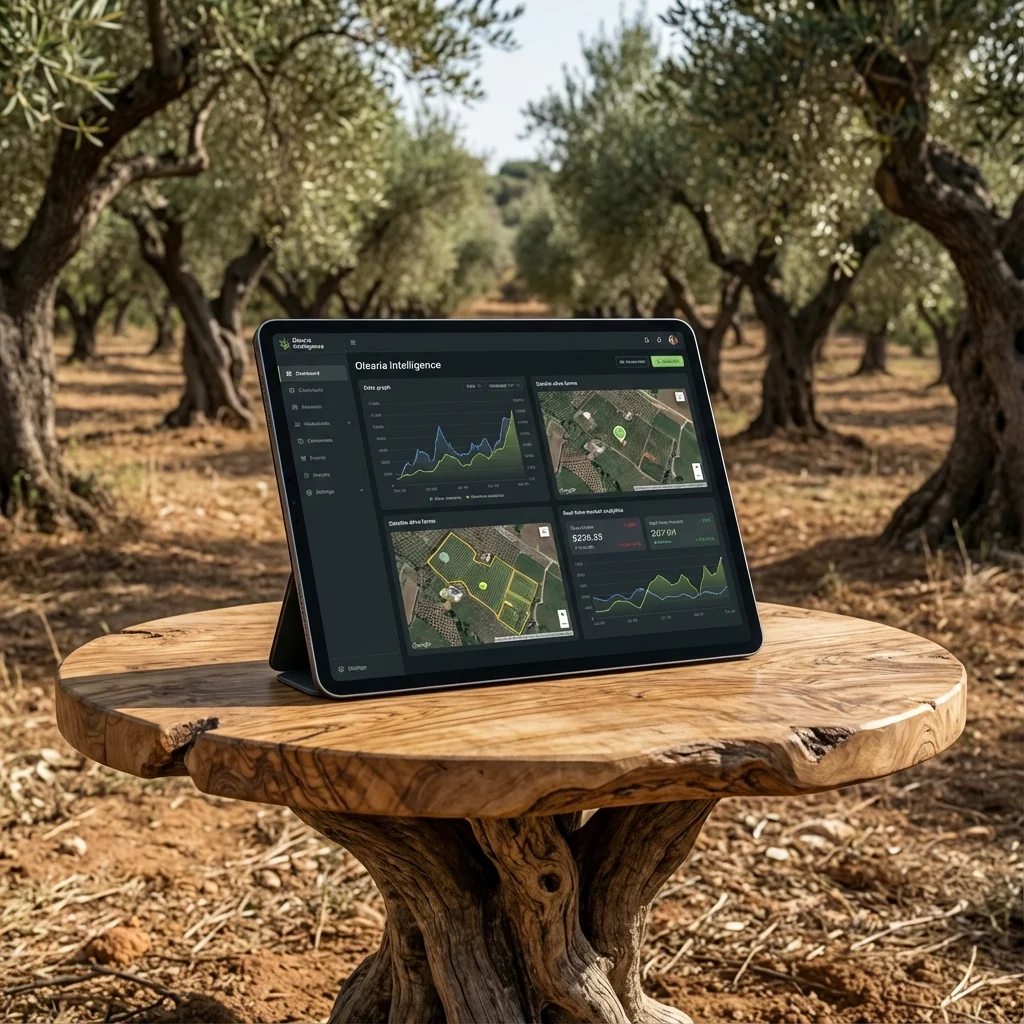
The first rule we set ourselves — and the first one we broke
A user had to understand the state of the market in less than ten seconds. If it took longer, we had failed.
The rule was good. What we built to fulfil it, not so much.
At first we designed elaborate charts with multiple overlaid indicators. We thought they looked impressive. We showed them to people in the sector while we were building the platform. They asked for a big number with today’s price and whether it was up or down. We had designed for desktop screens. They told us they would check the platform from their phone, out in the field, with patchy coverage. We had assumed that whoever opened the platform had time and context. They open it between meetings, in the van, with a specific question they need to answer in two minutes.
Every conversation with someone in the sector during those months showed us something we had got wrong.
The dashboard we have today is the result of that learning. Fourteen widgets that update automatically: prices in the four European markets, technical signals, campaign balance, machine-learning forecast, sector event calendar, trade flows in a mini-map, cost indicators, weather, competing commodities, and relevant news. Each widget answers one specific question. Depth is one click away, but it doesn’t fight for attention with what matters most.
It took us longer than we’d like to admit to arrive at something so simple.
Twenty-five years of prices and the Thursday problem
The market module is the heart of the platform. It contains the official European Commission prices going back to the year 2000, broken down by quality — EVOO, Virgin, Lampante, Refined — and by more than thirty regional markets. Jaén, Córdoba, Seville, Puglia, Crete, the Alentejo, Tuscany. The four big European producers: Spain, Italy, Greece, Portugal.
European Commission prices are published on Thursdays. Sometimes on Fridays. Sometimes a week late. In a market where a day’s difference can mean cents per kilo on thousands of tonnes, that lag matters.
For Spain we also pull daily at-source prices — the ones published every morning. Our extractors grab prices for EVOO, Virgin and Lampante every hour. When the official European data is more than seven days late, the system generates its own estimates using a model trained on more than twenty years of data.
But a price on its own means nothing. Is €4.30 per kilo a lot or a little? It depends when you look. Two years ago it was at €8. The all-time low was €1.60. So every market view includes historical percentiles — where in the range of the last twenty-five years the current price sits — spreads between qualities and between countries, and campaign-over-campaign comparisons.
Everything comes from official, verifiable sources. If a number appears on the platform, you can trace it back to the original source. We don’t have “exclusive data” of mysterious origin. That limits us. But we believe it is what makes the information solid enough to make real decisions with.
What ten thousand weeks of backtesting taught us
This is where it gets interesting, and where reality corrected us the hardest.
When we built the price estimation model, the first version assumed something that seemed obvious: that Mediterranean olive oil markets are strongly correlated. That when Spain rises, Italy follows with a small lag. That the Spanish market drags everyone else along.
We ran walk-forward backtesting with data going back to 2002. More than ten thousand weeks evaluated. And the results told us we were wrong.
The Mediterranean markets are more independent than we assumed. The influence factor from Spain to Italy turned out to be much smaller than expected. Each market has its own dynamics, its own timing, its own buyers and sellers responding to local signals.
Our model for Spain combines several statistical indicators with daily data as a leading signal. It beats a simple momentum model by 6–9%, with hit rates between 69% and 74% depending on quality. Statistically significant. Modest, but real.
And then there is Portugal.
Portugal had us stuck for weeks. The technical signals came out consistently backwards. The model would buy when it should sell and sell when it should buy. It took us a while to understand that Portugal behaves as a follower market with dynamics that are literally the inverse of what you would expect if you looked only at momentum. You have to invert the component for the signals to make sense.
It is the kind of thing that doesn’t appear in any manual. It is also the kind of thing that reminds you why you can’t build a market intelligence system from a desk, assuming the data will behave the way you think it should.
The signals nobody was applying to olive oil
Talking to people in the sector during development, something surprised us: many traders were already thinking about olive oil as a financial asset — looking for patterns, trying to spot market bottoms and tops — but they were doing it with generic tools that don’t understand the particularities of this market.
We built a professional technical analysis module. RSI, MACD, Bollinger, volatility across multiple windows, momentum. But the interesting part wasn’t the indicators themselves — it was what we found when we validated them against twenty-five years of data.
The best predictor, by a clear margin, is four-week momentum. The composite signal that works best weights momentum at 40%, RSI at 25%, correlation with satellite vegetation data at 20% and seasonality at 15%.
The seasonality result turned out to be fascinating. Each country has its own pattern that repeats with surprising stability decade after decade. In Spain, prices tend to rise in September and October, when the new campaign is kicking off and supply is still uncertain. In Italy, August is the strongest month. Portugal peaks in November and January. These are patterns that sector veterans intuit, but nobody had quantified them over two decades of data.
Quantifying them doesn’t make them easier to exploit — the market is too small and too influenced by unpredictable factors. But they help calibrate expectations in moments of volatility, which is exactly when you most need something solid to hold on to.
The risk module that showed up by accident
During those conversations, a trader asked whether we could calculate a Value at Risk for him.
At first it seemed out of place. Banking metrics for olive oil? But the more we thought about it, the more sense it made. Cooperatives store thousands of tonnes of oil in their cellars. That is an open position — exposure to price risk, whether they like it or not. And nobody was measuring it.
Today the module has seven tabs. VaR with three methods — historical, parametric, and Cornish-Fisher to adjust for skewness in the return distribution. CVaR for extreme scenarios. Backtesting with the Kupiec test to verify that the models deliver what they promise. Stress testing with real historical scenarios: the 2008 financial crisis, the 2017 Mediterranean drought, COVID, the war in Ukraine with its +80% in energy and +120% in fertilisers. Asset correlations with three statistical methods. Monte Carlo simulations with up to fifty thousand trajectories. And portfolio optimisation using the Markowitz efficient frontier.
These are tools that have existed in financial markets for decades. Nobody had simply applied them to olive oil.
In doing so, we discovered something that should worry anyone with a large position in this market: it has fat tails. Extreme events are considerably more frequent than a normal distribution would predict. Classic parametric VaR systematically underestimates real risk. It isn’t something you can see without the data in front of you. And once you see it, you can’t unsee it.
Half a million square kilometres from above
The satellite observatory started with nine regions and one vegetation index. Today it monitors thirty-seven regions across nine Mediterranean countries, from Andalusia to Lebanon, with six spectral indices and two derived metrics.
The data comes from European earth observation satellites with a resolution of ten metres per pixel. We process the spectral bands to compute indices that reveal vegetation status. Each pixel is automatically filtered: clouds, shadows, water and defective pixels are discarded before any calculation is made.
And here again reality corrected us.
The standard vegetation index — the one used by most of academia — doesn’t work well for olive groves. In a traditional grove where the trees are spaced eight to twelve metres apart, most of what the satellite sees is bare ground. The standard index is measuring more soil than trees. We had to switch to indices designed specifically for sparse crops, with mathematical correction for soil brightness. The difference in accuracy is significant.
Of all the indices we calculate, three are the ones we consider most valuable for the sector.
A soil-corrected vegetation health index. A water stress index that detects problems four to seven days before the trees show visible symptoms — long enough to act if you have irrigation. And a leaf area index that correlates between 70% and 85% with final production, which means you can estimate the harvest four or five months before picking.
That last figure matters a lot. A cooperative will be able to make volume projections in July for a harvest that won’t happen until November. That completely changes how logistics are planned and how negotiations are framed.
Three times a day, the system launches automatic extractions with a backup mechanism in case the primary source hits its processing quota. Across 540,362 square kilometres of Mediterranean olive groves, there is always something being processed.
Who sells to whom, and at what price
The international trade module was a project in itself.
Automatically extracting EU trade data requires more patience than you might imagine, because official European sources are… temperamental. Sometimes they don’t respond. Sometimes they return data in formats that have changed without warning. There are endpoints that worked perfectly last week and go silent the next.
Raw foreign trade data is hard to digest. What we did was give it shape. Sankey diagrams that visually show who sells to whom. Treemaps of export destinations. A trade efficiency index that quantifies something the sector intuits but rarely measures: Italy exports less volume than Spain, but at a higher price per tonne. The Herfindahl-Hirschman concentration index to detect single-market dependency. The Gini coefficient to measure inequality in flow distribution.
You can see how Tunisia has grown as an exporter over the last decade, reshaping the competitive dynamics of the Mediterranean. How Spanish exports to the United States — which top a billion euros a year — live under the permanent shadow of tariffs. How global flows reorganised after the 2023–2024 price crisis.
The story of olive oil as a global market is written in those flows. Until you see them all side by side in one place, you don’t realise how many pieces the puzzle has.
The forgotten half of the equation
Everyone talks about prices. Almost nobody talks about costs.
We have historical series of Eurostat energy indices, quarterly transport costs, agricultural inputs — NPK fertilisers, crop protection products, labour — and inflation. With that data you can do something that surprisingly few people do: calculate whether you are actually making money, not just turning over revenue.
According to AEMO data, production costs vary radically depending on the growing system: irrigated super-intensive olive groves can produce at €2.81 per kilo — the most efficient in the market. Traditional low-slope rain-fed groves hover around €4. Mountain olive groves reach €4.61 per kilo. With EVOO at source near €4.30, the implications are obvious — and no less worrying for that.
The one with comfortable margin is the well-managed super-intensive grove. The one on the razor’s edge is the traditional rain-fed grove and, especially, the mountain grove — the one that costs more to produce than it is worth on the market. These are precisely the systems most tied to the land, the landscape and Mediterranean olive culture, and they have the tightest numbers.
Until you see those numbers side by side, you don’t fully appreciate how thin those margins have become.
177 automatic tasks a day — and what happens when they fail
Behind every module there are sixteen automatic extractors running at different frequencies. The system executes 177 scheduled tasks a day.
Every hour, from seven in the morning to eleven at night: currencies, Spanish at-source prices, official European prices, market indicators, energy, commodities, consumer confidence, non-European market prices, foreign trade. Three times a day: satellite data. Once a day: weather forecasts. Quarterly: agricultural inputs and transport. Annually: trade balance and world production from the International Olive Council.
Each extractor knows when to run, what data to request, and what to do when something fails. Because official sources fail. Constantly.
In October 2025, the European Commission’s API changed the names of Greek markets from English to Greek without any warning. Overnight, “Chania” became “Χανιά”. “Heraklion” became “Ηράκλειο”. For a system that has spent years normalising market names under a consistent format, that is a silent breakage: the data keeps arriving, but it no longer matches historical records. We noticed because the charts for Greece started showing gaps where there shouldn’t have been any.
We have also seen publications with errors that turn 3.50 into 350. Deprecated endpoints with no notice. The Eurostat COMEXT API that sometimes simply doesn’t respond — no error code, no message, just silence.
Every one of those problems has happened to us at least once. We have market-name normalisation tables to handle the variations. Retry with exponential backoff. Validations that detect anomalous prices. The invisible work of keeping all this running is probably 70% of the real effort of building a data platform.
Nobody sees it. It is the most important thing we do.
The assistant we had to rebuild three times
This is probably what has changed the most over the last few months. And also what has cost us the most.
The first version was a chatbot with access to data. Keywords that triggered queries: “price” called the price API, “weather” called the weather API. Simple. And poor.
60% of the time it answered “I don’t have enough information.” We ran documented tests and only nine out of sixteen queries worked. The system didn’t extract data properly, invented numbers when the structure didn’t match, and picked the wrong tools. Four out of ten answers were incomplete or outright fabricated.
We rewrote it from scratch. Twice.
Today the assistant works in a radically different way. When you ask a question, an intelligent planning system analyses what you really need — not by keywords, but by understanding the query: type of analysis, time horizon, geographical scope, oil quality — and decides exactly which data to query from our database of more than two million records. It doesn’t go through intermediate APIs: it queries the raw data directly, runs the required calculations and synthesises a grounded response.
Every number in the response is automatically verified against the source data. If it says EVOO in Jaén is at €4.27, that €4.27 exists in the database and comes from an official source. If it cannot verify a number, it says so.
What cost us the most was getting it to cross domains naturally. Questions like “I have 4,000 kilos of lampante in Jaén — should I sell now or wait until September?” require current price data, technical indicators, historical seasonality of lampante, national stock balance, harvest forecast, weather and grove status. All cross-referenced. When it works — when you throw something complex at it and it comes back with an answer that integrates six different data sources, calculates the seasonality of lampante for September over the last five years, compares that with the price you’ve been offered and recommends a staggered sales strategy — it is the kind of analysis that would take a consultant half a day.
We also learned that comparing regions isn’t as simple as putting two numbers side by side. An NDVI of 0.35 in Jaén may be excellent for its climate, while the same value in Tuscany would be worrying. For the comparison to make sense, each region is first compared against itself in the same month in previous years. Only then can you evaluate whether an area is doing better or worse than expected, and compare it to another region honestly.
The system has fifteen advanced calculation operations — from means and trends to correlations between variables, monthly seasonality, anomalies versus historical averages, compound annual growth, and statistical distributions — that run over twenty-five years of data in some cases. And it has proactive alerts: if there is a frost risk in your area, or if a market indicator crosses a threshold, it tells you even if you didn’t ask.
It is not perfect. There are questions it still doesn’t resolve with the precision we would like. But it no longer invents data, no longer says “I don’t have information” when it does, and every answer carries a verification indicator that tells you what percentage of the numbers have been cross-checked against original sources.
Reports that write, lay out and translate themselves
Every week the platform generates a market intelligence report. Three A4 pages, professional editorial design, charts rendered automatically. Without anyone writing a single word.
The process has four phases that run automatically.
First, the data collector goes out to fetch information from fifteen sources: daily Spanish prices, weekly prices of the four European markets with the full historical series, the EUR/USD exchange rate, technical indicators, competing commodities, energy and transport costs, satellite vegetation status, accumulated growing-degree days for the nine Mediterranean countries, weather alerts, the current phenological phase of the olive tree, trade flows, production.
Then, the inference engine calculates twelve derived metrics. Historical percentiles for each price. Margins over production costs — distinguishing between traditional, intensive and super-intensive groves, using AEMO and MAPA data. Spreads between qualities and between countries. Correlations. Ratios against competing commodities.
Next, an AI model writes the analysis. With a cascade system — if the primary model fails, it automatically falls back to the secondary one — it generates the editorial that puts the numbers in context. Including what we internally call the “causal chain signal box”: a panel that cross-references signals from the physical world (weather, satellite), the financial world (prices, volatility, momentum) and the biological world (phenology, production) to provide an integrated reading.
Finally, the PDF is rendered. Three pages: Market, Field/Supply, and Editorial. The automatic layout process looks simple until you spend two afternoons fighting with print margins.
The result is something a cooperative can put in front of its board, or that a trader can read in three minutes to catch up. Written by a machine at four in the morning while nobody was watching.
The calendar that thinks in phenological terms
One of the modules that has surprised us most during development is the smart market calendar.
It is not a calendar with dates on it. It is a rules engine with twenty predefined conditions, organised by the phenological phase of the olive tree — winter rest, floral differentiation, budding, flowering, fruit set, fruit growth, veraison, ripening, harvest — that evaluates real-time data and generates action recommendations.
If we are in flowering and the water stress index rises above a threshold, the system generates a critical alert with a specific recommendation. If we are in harvest and price momentum exceeds 5% per week, it generates an opportunity. Everything filtered by perspective: buyer or seller.
It sounds simple. It isn’t. Mapping the ten phenological phases of the olive tree, with their variations by country and region, cross-referencing them with weather, vegetation, market and historical data, and producing actionable insights that someone can apply that same morning, required an amount of agronomic research we hadn’t anticipated.
This happens to us a lot. Not anticipating how much work something that looks simple from the outside actually takes.
The forecasts, honestly
Predicting the price of olive oil is very hard. It depends on weather factors nobody controls, unpredictable political decisions, and negotiations between a relatively small number of large players. Anyone promising certainties is lying.
That said, we have models in production. For Spain, a statistical model with cross-validation over more than twelve hundred weeks. For Italy, an ensemble that combines three models with optimised weights. For Greece and Portugal, simpler models because the historical data is scarcer.
The results are modest but real: 6–9% improvement over a simple momentum model, with hit rates between 69% and 74% depending on quality. Statistically significant.
We present it for what it is: one more tool in the decision-making arsenal. We show confidence ranges, not points. When the model doesn’t have enough confidence to say something useful, it says so openly.
We believe that is the only honest way to present it. If someone wants resounding certainties, there is no shortage of people willing to sell them. We prefer that whoever uses the platform knows exactly what they can and cannot trust.
The moment we are in
It is an interesting moment to launch something like this.
The olive oil market has lived through two years of intense transformation. Prices spiked to €8 per kilo, fell back, and the current campaign is generating uncertainty again. Tariffs with the United States are already a reality, and Spanish exports to that market top a billion euros a year. Europe’s digital farm logbook becomes mandatory from 2027. European production recovered after the 2023 drought, but nobody can guarantee the next campaign won’t go back to where we were.
Volatility, trade barriers, regulatory pressure, climate change.
In that context, having access to integrated information — not scattered across twenty sites, not gossiped about in a WhatsApp group — can make a real difference. Not as a technological luxury. As an operational necessity.
What isn’t there yet
We have plenty of work ahead. Plenty.
We want to improve the forecasting models — the LSTM and Transformers we have on the roadmap. We want push alerts in real time when a threshold is crossed. We want to expand the directory from the 4,400 companies we have today to the full value chain. We want to open a public API so others can build on top of our data. We want native apps.
Every week we discover something we could do better. Every conversation with someone in the sector reveals a need we hadn’t considered. That is not a problem. It is exactly what should happen when you build something for real people who make decisions with real economic consequences.
Olearia Intelligence is not a finished product. It probably never will be. It is a living system — hundreds of thousands of lines of code, 177 daily tasks running on their own, a database with eighty-four tables that has been accumulating data from twenty different sources for nearly a year — built for people who work out in the field, negotiate in an office, or check the market at seven in the morning from their phone.
It started as a WhatsApp group. We still have a lot to learn.
We are in private beta. If you work in the sector and what we have described interests you, we are listening.
Interested in Olearia Intelligence? You can request access or email us at [email protected]. If you just want to talk about the sector, that also works. We always learn something from those conversations.
Original article published on AIXA AI.